


| Country : China | ||||||||||||
|---|---|---|---|---|---|---|---|---|---|---|---|---|
| Oils and Fats Ending Stocks | ||||||||||||
| Palm Oil (MT) | Soybean Oil (MT) | Sunflower Oil (MT) | Rapeseed Oil (MT) | Other Oils (MT) | Total Ending Stocks (MT) | |||||||
| 2026 | 2025 | 2026 | 2025 | 2026 | 2025 | 2026 | 2025 | 2026 | 2024 | 2026 | 2025 | |
| January | 709,200 | 418,900 | 883,300 | 757,300 | - | - | 242,000 | 551,000 | - | - | 1,834,500 | 1,727,200 |
| February | 799,400 | 356,000 | 855,300 | 816,200 | - | - | 271,000 | 683,500 | - | - | 1,925,700 | 1,855,700 |
| March | 826,100 | 322,500 | 811,500 | 740,200 | - | - | 302,000 | 791,500 | - | - | 1,939,600 | 1,854,200 |
| April | 696,000 | 343,000 | 739,500 | 579,600 | - | - | 355,000 | 814,000 | - | - | 1,790,500 | 1,736,600 |
| May | 762,500 | 330,400 | 818,300 | 689,900 | - | - | 363,000 | 781,500 | - | - | 1,943,800 | 1,801,800 |
| June | 724,100 | 463,800 | 1,012,100 | 837,900 | - | - | 412,000 | 747,000 | - | - | 2,148,200 | 2,048,700 |
| July | 585,500 | 989,300 | - | - | 673,000 | - | - | 2,247,800 | ||||
| August | 591,200 | 1,146,600 | - | - | 664,000 | - | - | 2,401,800 | ||||
| September | 543,100 | 1,178,300 | - | - | 583,000 | - | - | 2,304,400 | ||||
| October | 561,800 | 1,149,200 | - | - | 514,000 | - | - | 2,225,000 | ||||
| November | 643,000 | 1,123,300 | - | - | 368,000 | - | - | 2,134,300 | ||||
| December | 704,300 | 988,100 | - | - | 291,000 | - | - | 1,983,400 | ||||
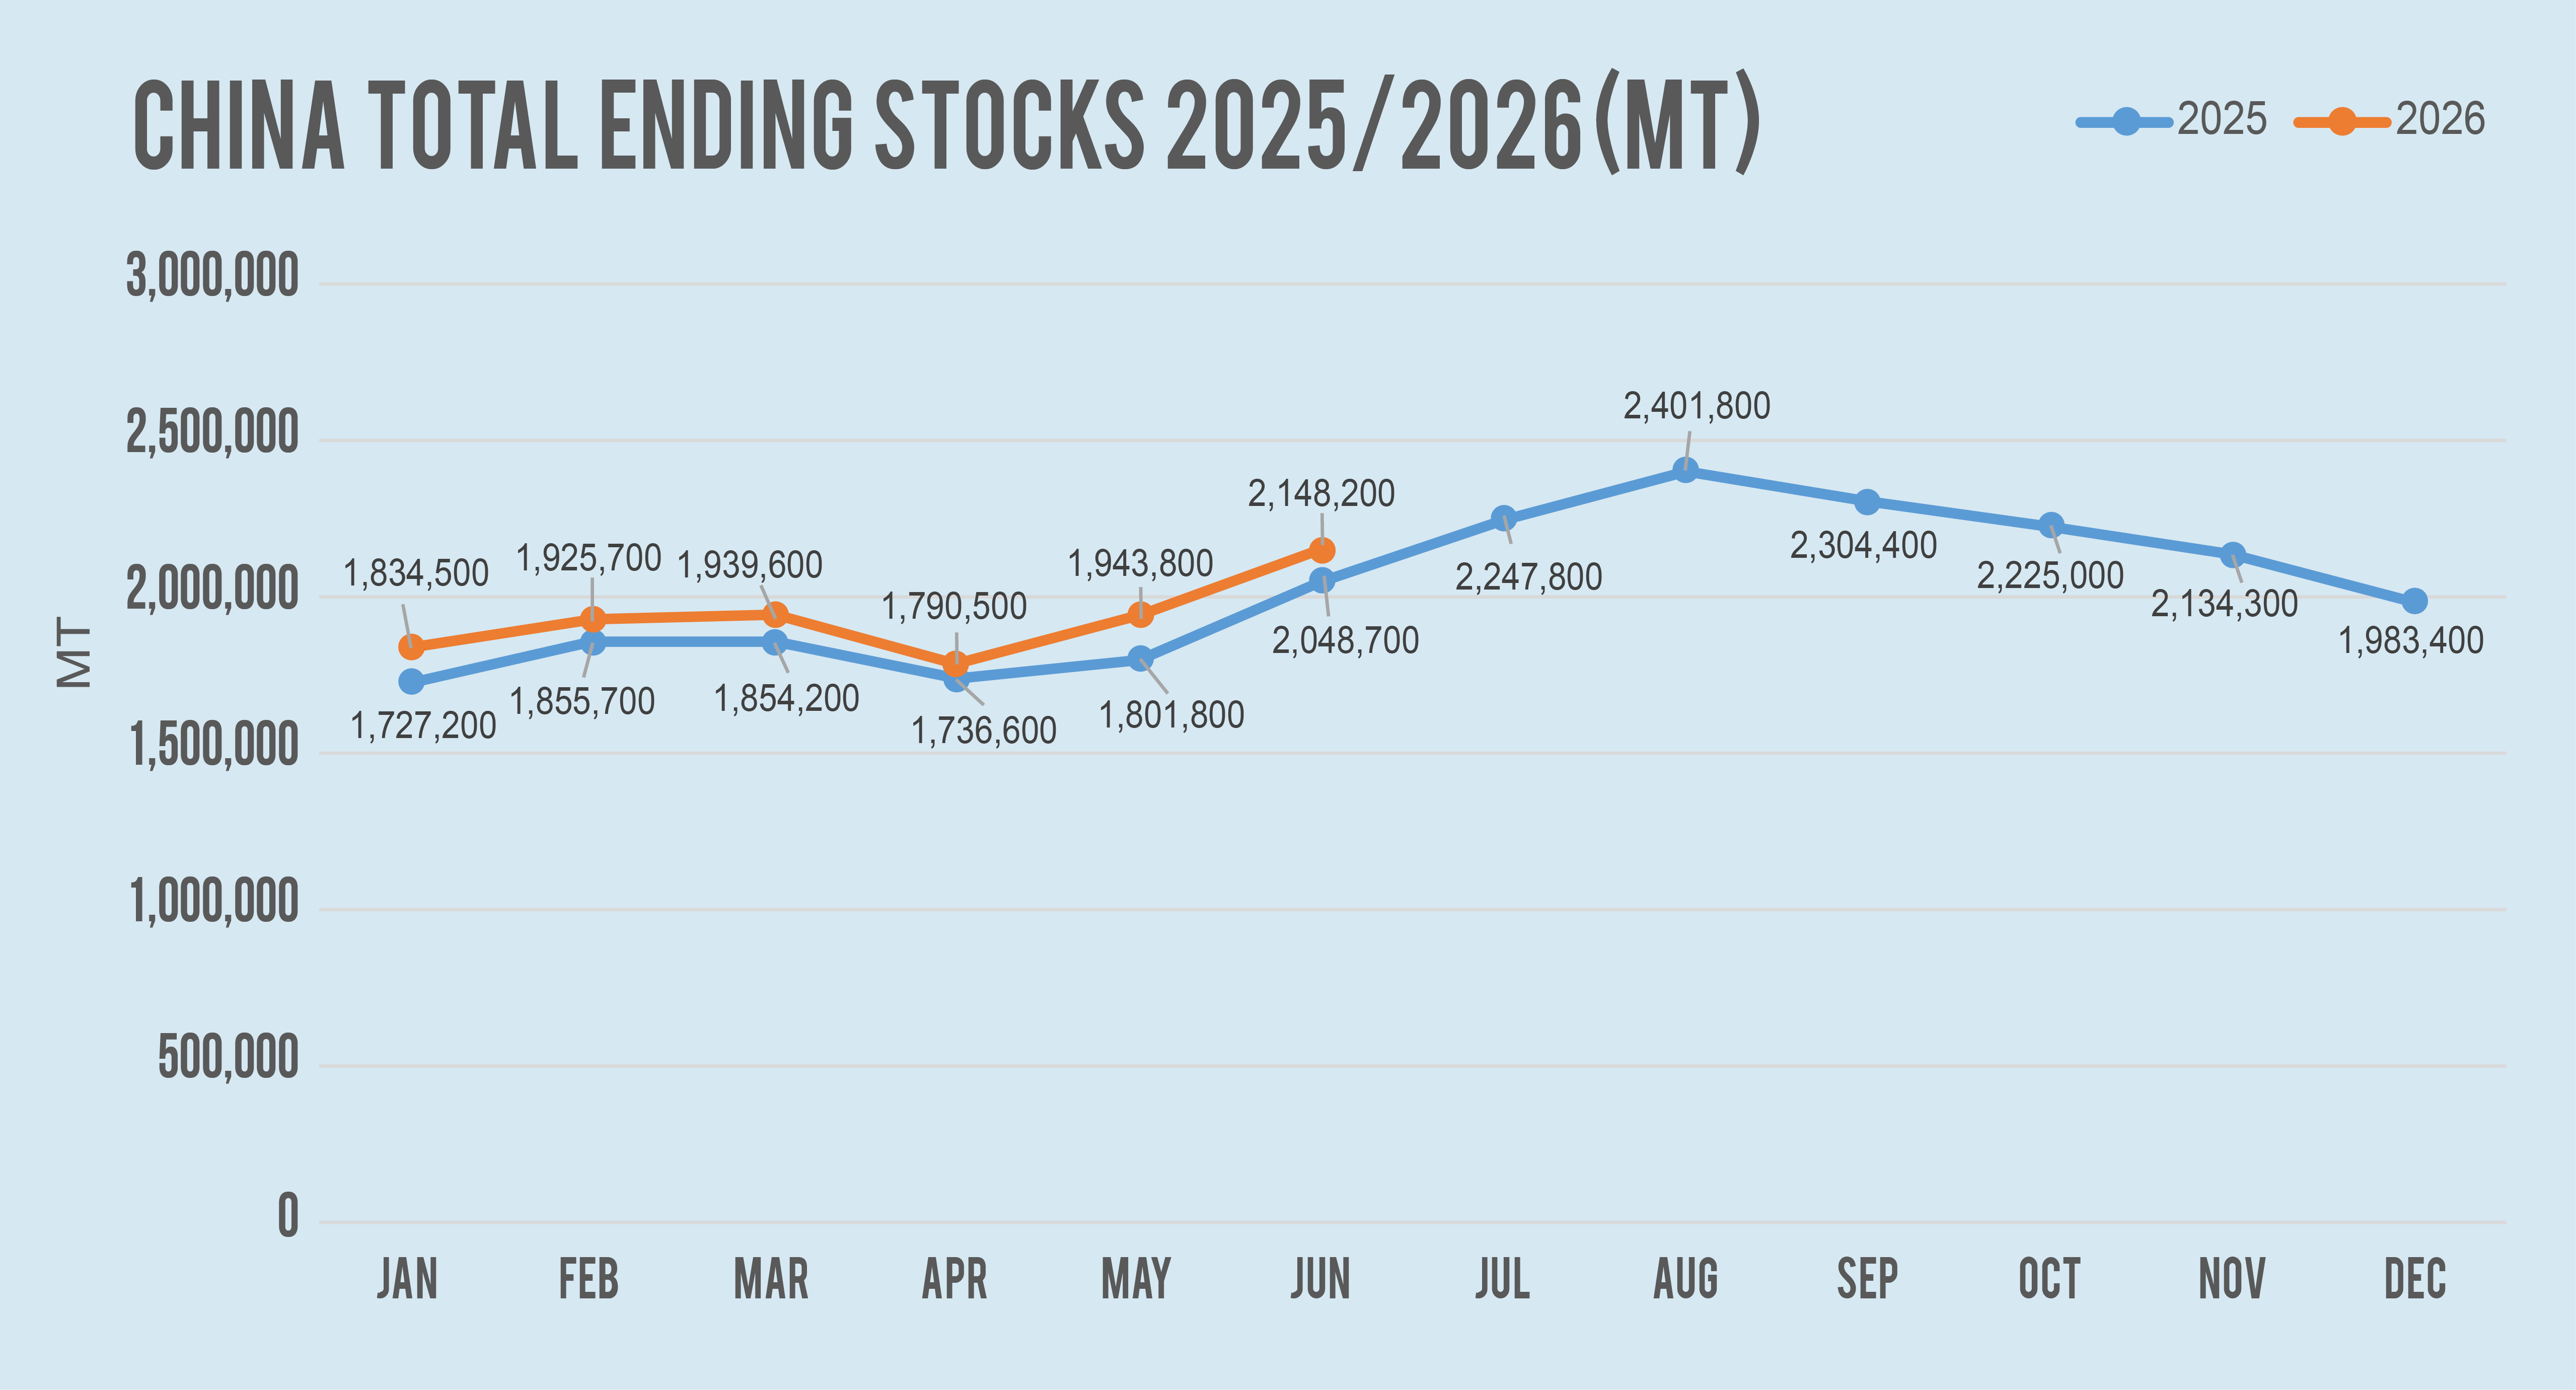
China’s total stocks of the three major vegetable oils-soybean oil (SBO), palm oil (PO), and rapeseed oil (RSO)-stood at 2.15 million metric tonnes (MT) at the end of June 2026, up 204,400 MT or 10.5% from the end of May, and 99,500 MT or 4.9% higher than a year earlier. Among them, palm oil was the only category to register a monthly decline, while soybean oil posted a sharp build and rapeseed oil edged steadily higher. With demand in its seasonal slack period, overall stocks are now above the multi-year average for this time of year.
PO was the only category among the three major vegetable oils to register a monthly decline in stocks. As of June 26, domestic palm oil stocks stood at 724,100 MT, down 38,400 MT or 5.0% from end‑May, though still 260,300 MT or 56.1% above the year‑earlier level of 463,800 MT. Despite the monthly drawdown, overall stocks remain historically high for the season. On a weekly basis throughout June, stocks continued to ease, driven by persistently negative import margins that discouraged import arrivals and by steady downstream consumption. Towards month‑end, the narrowing price spread between SBO and PO further boosted end‑user restocking appetite, reinforcing the overall stock‑drawdown trend for the month.
By end-June, SBO stocks had reached 1.01 million MT, representing a monthly surge of 193,800 MT (23.7%) and a yearly jump of 174,200 MT (20.8%). This sharp accumulation was underpinned by heavy soybean arrivals, which was estimated to over 10 million MT in June, according to the National Food and Strategic Reserves Data Center. This kept crushing margins positive and plant run rates high. SBO stocks climbed steadily throughout the month, hitting a six-year seasonal high. As a result, SBO emerged as the most burdensome surplus among the three major vegetable oils.
RSO stocks stood at 412,000 MT, up 49,000 MT or 13.5% from end-May, though still roughly 44.8% below the year-earlier level. While the monthly build reflects a modest rebound, total stocks remain at historical lows for the season. The increase was largely driven by concentrated arrivals of imported rapeseed, which lifted crushing volumes and boosted RSO output. On the demand side, the seasonal lull and cheaper substitutes, such as SBO and PO, continued to divert consumption away from RSO, leaving little fundamental support. With supply expanding and demand lacklustre, the rebuilding of RSO stocks is gradually gaining traction.
Source: MPOC Market Intelligence
*Disclaimer: This document has been prepared based on information from sources believed to be reliable but we do not make any representations as to its accuracy. This document is for information only and opinion expressed may be subject to change without notice and we will not accept any responsibility and shall not be held responsible for any loss or damage arising from or in respect of any use or misuse or reliance on the contents. We reserve our right to delete or edit any information on this site at any time at our absolute discretion without giving any prior notice.
| Country : India | ||||||||||||
|---|---|---|---|---|---|---|---|---|---|---|---|---|
| Oils and Fats Ending Stocks | ||||||||||||
| Palm Oil (MT) | Soybean Oil (MT) | Sunflower Oil (MT) | Rapeseed Oil (MT) | Other Oils (MT) | Total Ending Stocks (MT) | |||||||
| 2026 | 2025 | 2026 | 2025 | 2026 | 2025 | 2026 | 2025 | 2026 | 2025 | 2026 | 2025 | |
| January | 486,000 | 310,000 | 190,000 | 330,000 | 185,000 | 268,000 | 3,000 | - | - | - | 864,000 | 908,000 |
| February | 534,000 | 408,000 | 170,000 | 237,000 | 115,000 | 195,000 | - | - | - | - | 819,000 | 840,000 |
| March | 413,000 | 335,000 | 103,000 | 225,000 | 93,000 | 260,000 | - | - | - | - | 609,000 | 700,000 |
| April | 466,000 | 265,000 | 180,000 | 135,000 | 190,000 | 300,000 | - | - | - | - | 836,000 | 720,000 |
| May | 364,000 | 290,000 | 265,000 | 175,000 | 310,000 | 285,000 | - | - | - | - | 939,000 | 750,000 |
| June | 316,000 | 340,000 | 280,000 | 180,000 | 310,000 | 220,000 | - | - | - | - | 906,000 | 740,000 |
| July | 445,000 | 250,000 | 250,000 | - | - | 945,000 | ||||||
| August | 535,000 | 215,000 | 210,000 | 6,000 | - | 966,000 | ||||||
| September | 540,000 | 290,000 | 195,000 | 4,000 | - | 1,029,000 | ||||||
| October | 570,000 | 270,000 | 160,000 | 3,000 | - | 1,003,000 | ||||||
| November | 627,000 | 265,000 | 125,000 | 6,000 | - | 1,023,000 | ||||||
| December | 456,000 | 300,000 | 200,000 | 5,000 | - | 961,000 | ||||||
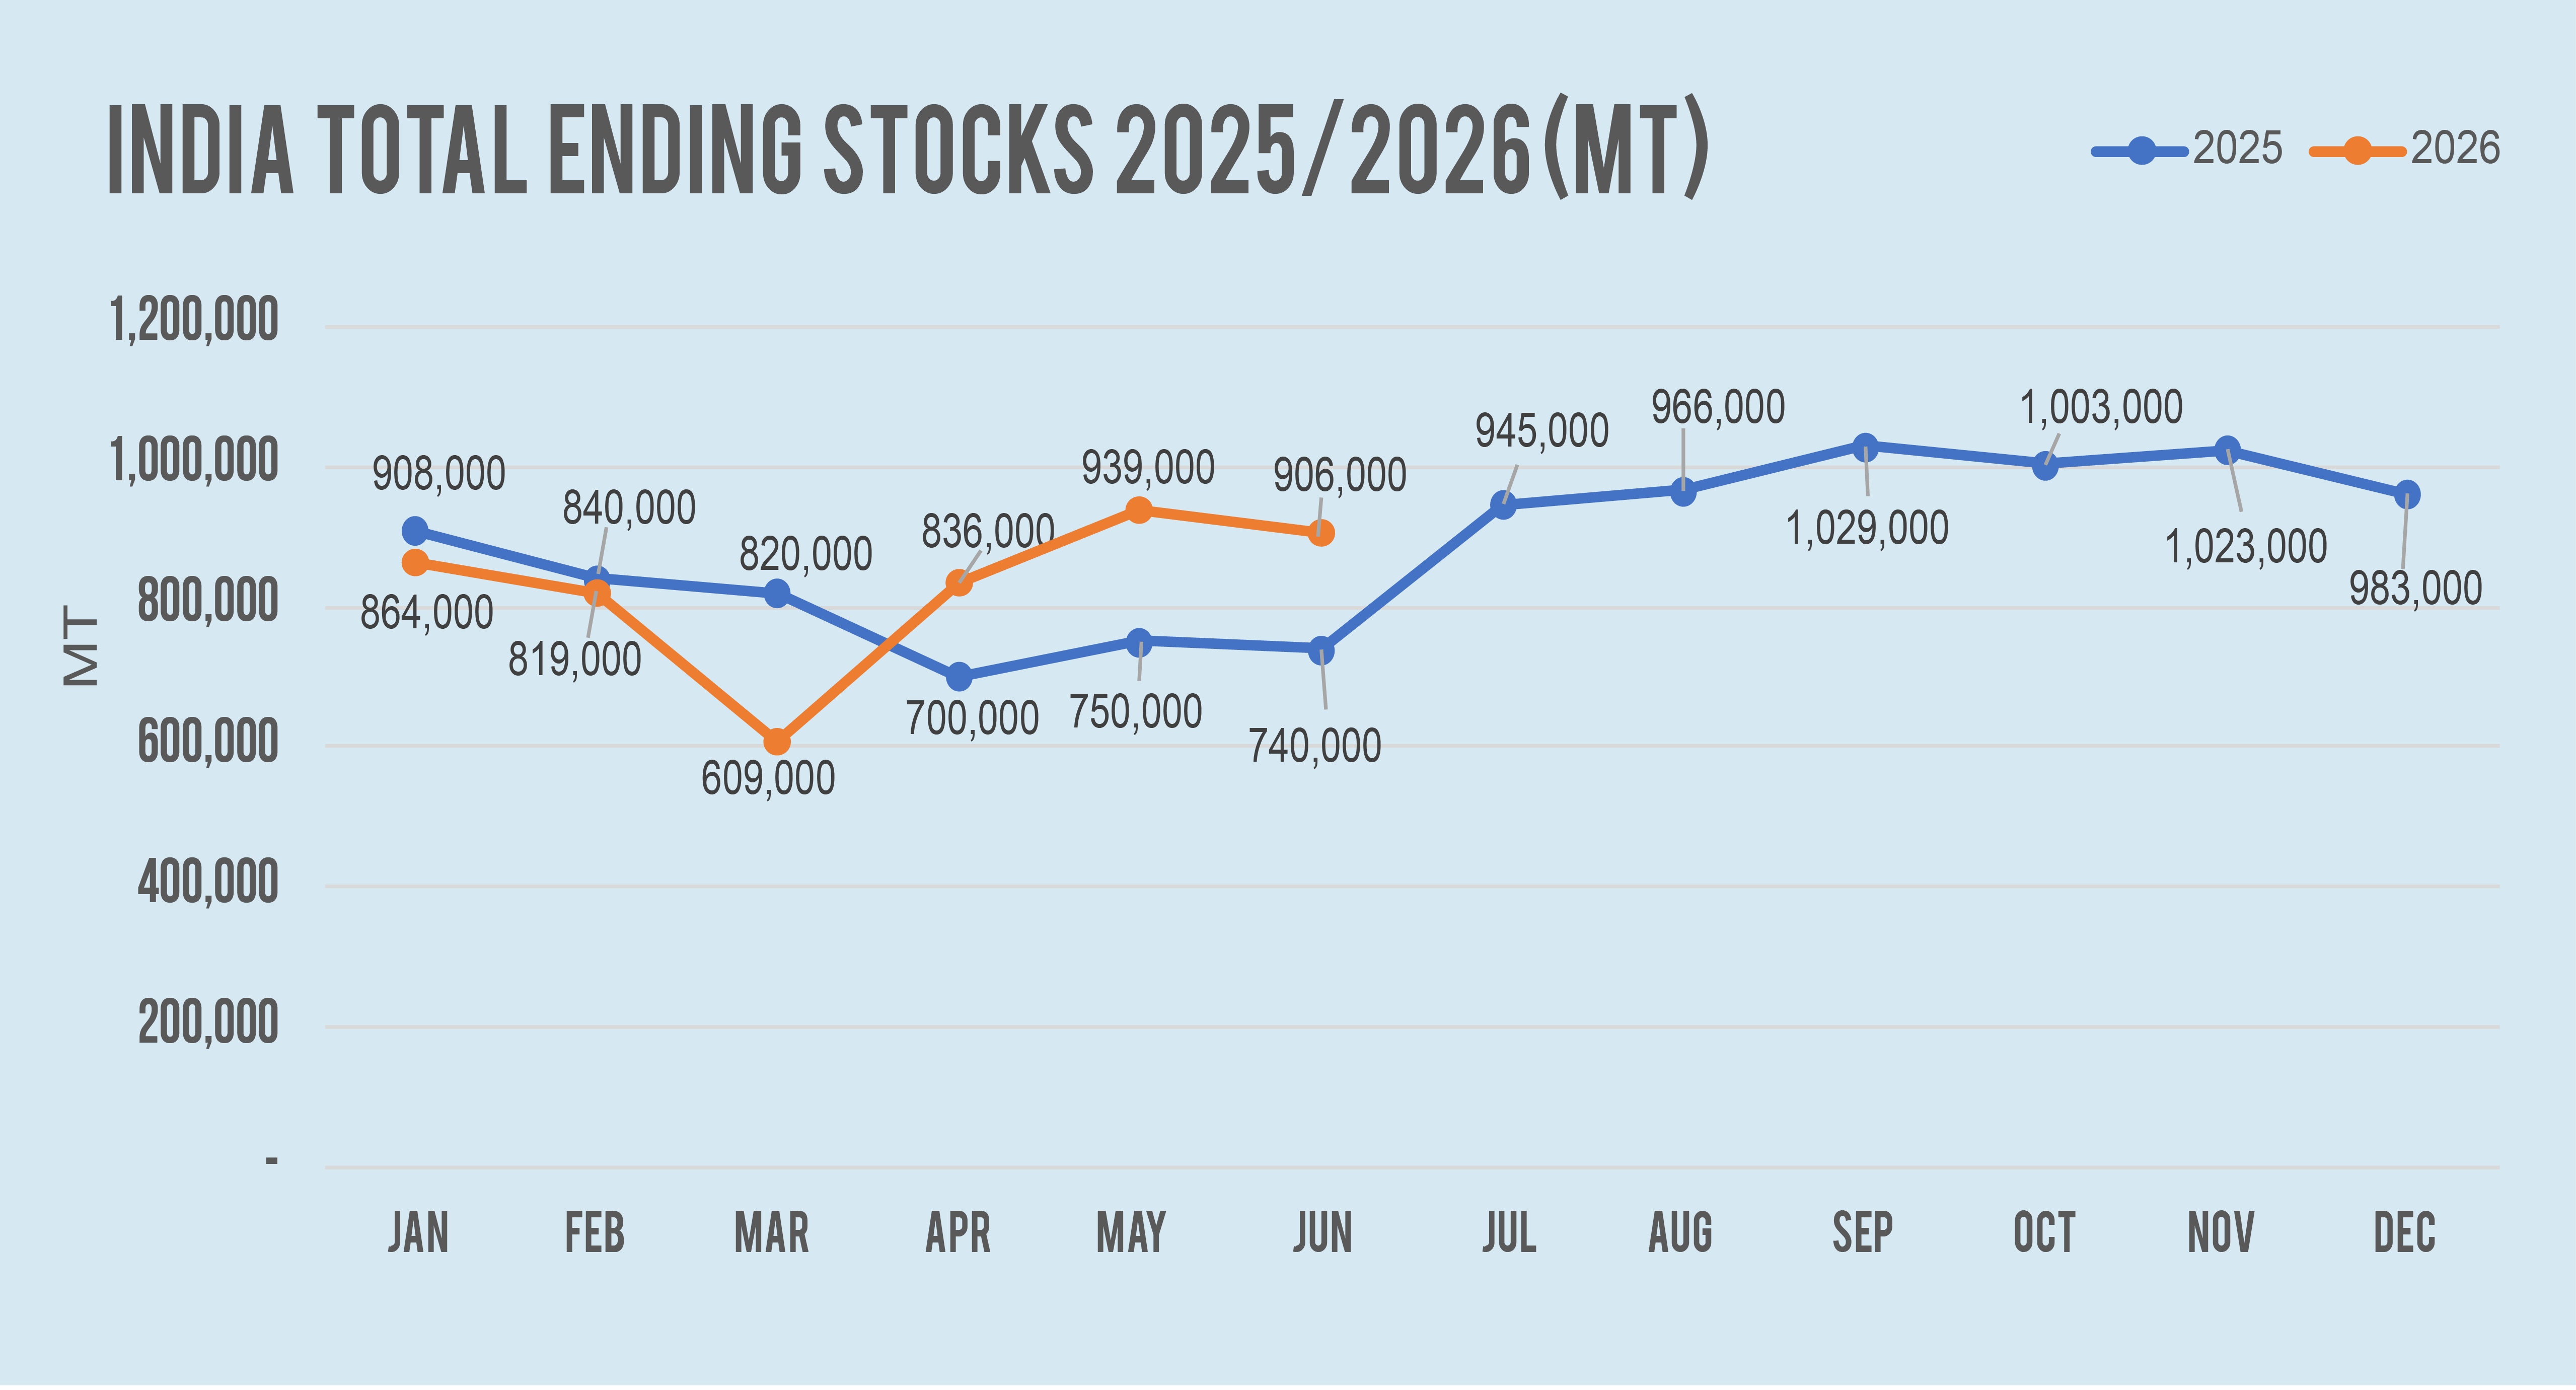
In June 2026, India’s total edible oil ending stocks at ports moderated slightly to approximately 906 KMT, compared to 939 KMT in May, representing a 3.5% month-on-month (MoM) decline. Despite the marginal reduction, total inventories remained 22.4% higher year-on-year (YoY) than the 740 KMT recorded in June 2025, indicating that overall edible oil availability in the market continues to remain comfortable.
The slight decline in total inventories was primarily driven by a reduction in palm oil stocks, while inventories of soybean oil and sunflower oil remained at elevated levels following strong import arrivals over the previous three months. This reflects a gradual rebalancing of inventories as refiners adjusted procurement strategies in response to changing price competitiveness among the major edible oils.
Palm oil inventories declined further to 316 KMT in June from 364 KMT in May, representing a 13.2% MoM decrease and a 7.1% YoY decline compared with 340 KMT in June 2025.
The lower stock level reflects steady domestic consumption together with relatively lower import arrivals during the month, following the substantial inventory accumulation recorded during the first quarter of 2026. Despite the decline, palm oil continues to remain the largest imported edible oil and an essential component of India's edible oil supply chain due to its affordability, versatility and extensive use.
Soybean oil inventories increased further to 280 KMT, compared with 265 KMT in May, representing a 5.7% MoM increase and a 55.6% YoY increase over 180 KMT in June 2025. The continued build-up reflects sustained import arrivals and improved global availability, particularly from South America, enabling refiners to maintain higher inventory levels amid favourable price competitiveness.
Sunflower oil inventories remained unchanged at 310 KMT, maintaining the highest stock level recorded so far in 2026 and representing a 40.9% YoY increase compared with 220 KMT in June 2025. The elevated inventory position reflects the continued impact of strong import arrivals from the Black Sea region during April and May.
Overall, the June stock position indicates that while total inventories eased marginally due to lower palm oil stocks, India's edible oil supply situation remains well balanced with comfortable availability across all major vegetable oils.
Pipeline stocks are estimated at approximately 1.10 MMT, bringing total port and pipeline inventories to around 2 MMT. This continues to indicate comfortable supply coverage for the coming months.
Source: MPOC Market Intelligence
*Disclaimer: This document has been prepared based on information from sources believed to be reliable but we do not make any representations as to its accuracy. This document is for information only and opinion expressed may be subject to change without notice and we will not accept any responsibility and shall not be held responsible for any loss or damage arising from or in respect of any use or misuse or reliance on the contents. We reserve our right to delete or edit any information on this site at any time at our absolute discretion without giving any prior notice.
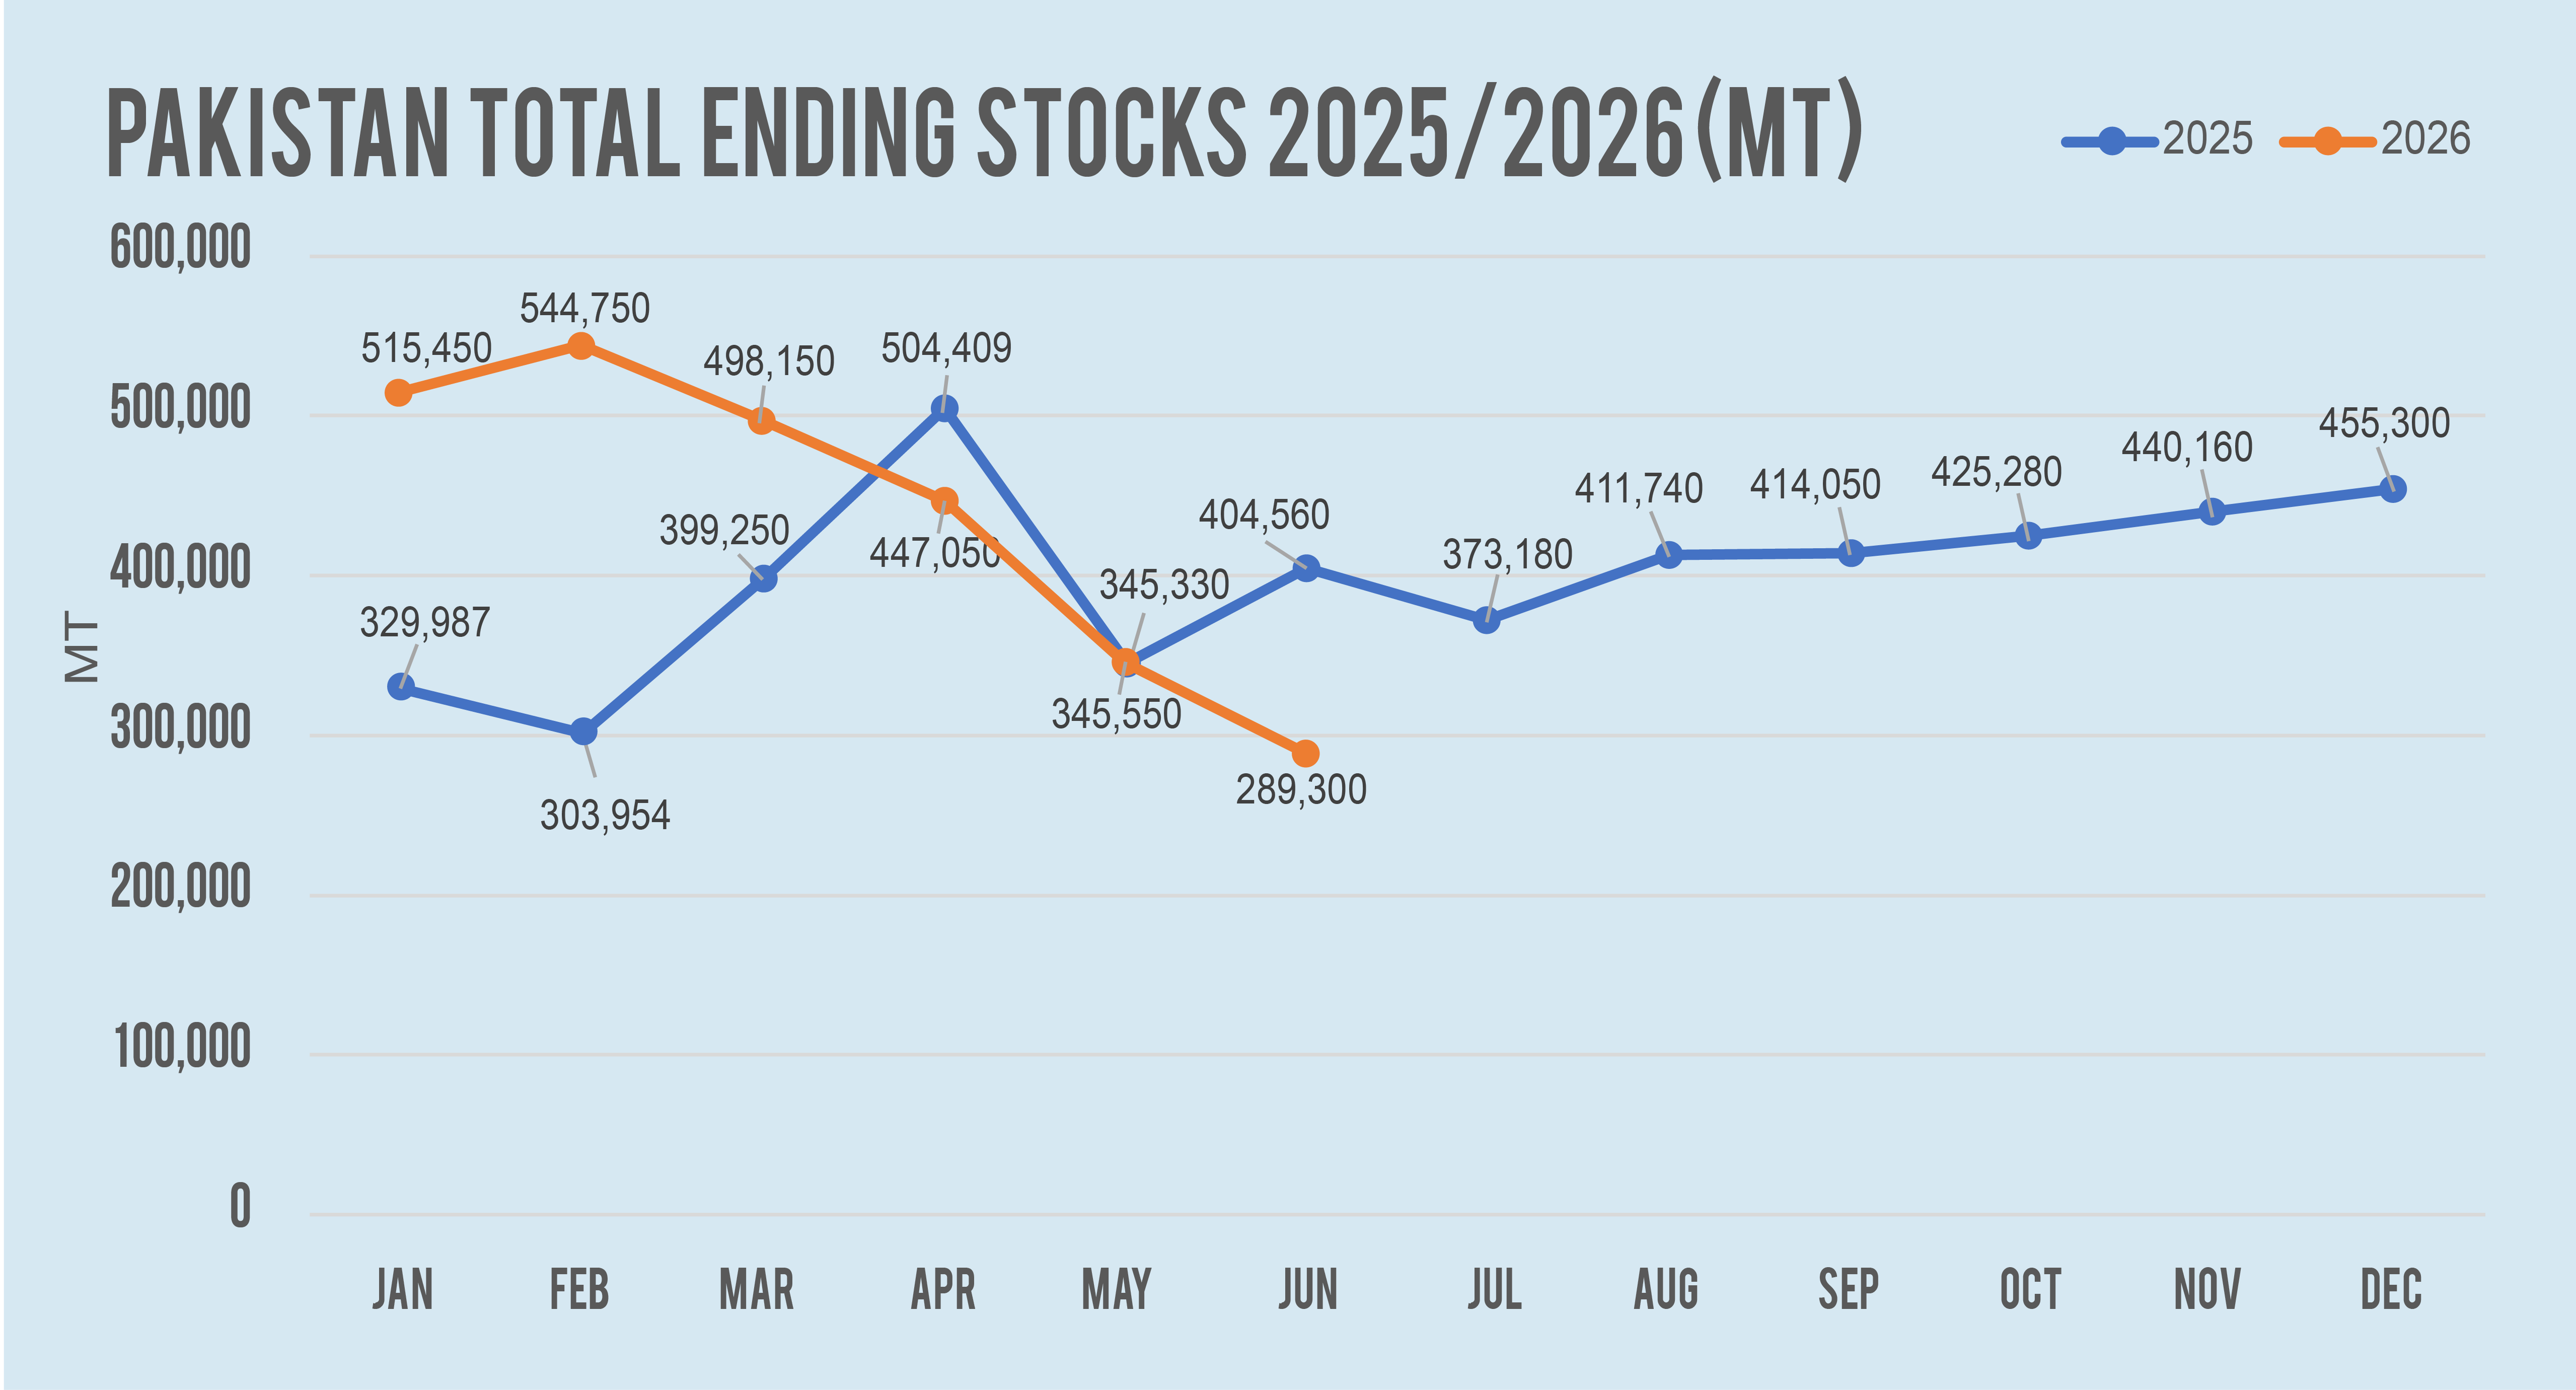
Edible oil stocks at Port Qasim Authority (PQA) and Karachi Port Trust (KPT) declined to 289,300 MT at the end of June 2026, down 16.3% month-on-month and 28.5% lower year-on-year. This marks a further tightening in port inventories following three consecutive months of stock drawdown.
June edible oil imports totalled 221,669 MT, compared to 142,499 MT in May, representing a 55.6% month-on-month increase. Despite the rebound, import volumes remained primarily driven by inventory replenishment rather than an improvement in underlying demand.
The reduction in port stocks reflects the correction of the substantial inventory overhang that accumulated following exceptionally high edible oil imports during the last quarter of 2025 and first quarter of 2026. The excessive stocks had created a significant disparity between fresh import costs and domestic market prices, with import parity deteriorating by as much as USD 80 to 100/MT. As a result, importers reduced purchases during the second quarter of 2026 and relied on existing inventories to meet domestic requirements.
As stocks gradually declined over recent months, the gap between import costs and domestic prices narrowed, restoring import parity and making fresh purchases commercially viable once again. The increase in June imports therefore largely reflected the need to replenish depleted inventories rather than a material strengthening in consumption.
Looking ahead, July edible oil imports are expected to increase further to around 250,000 MT as importers continue rebuilding stocks following the substantial reduction in terminal inventories.
Of the total 289,300 MT of edible oil stocks held at Port Qasim Authority (PQA) and Karachi Port, RBD palm olein represented the largest portion at 63.9%, while RBD palm oil accounted for 31.3%. Overall, palm oil and its different fractions continued to dominate inventory composition, comprising 95.2% of total ending stocks.
Source: MPOC Market Intelligence
*Disclaimer: This document has been prepared based on information from sources believed to be reliable but we do not make any representations as to its accuracy. This document is for information only and opinion expressed may be subject to change without notice and we will not accept any responsibility and shall not be held responsible for any loss or damage arising from or in respect of any use or misuse or reliance on the contents. We reserve our right to delete or edit any information on this site at any time at our absolute discretion without giving any prior notice.
| Country : Bangladesh | ||||||||||||
|---|---|---|---|---|---|---|---|---|---|---|---|---|
| Oils and Fats Ending Stocks | ||||||||||||
| Palm Oil (MT) | Soybean Oil (MT) | Sunflower Oil (MT) | Rapeseed Oil (MT) | Other Oils (MT) | Total Ending Stocks (MT) | |||||||
| 2026 | 2025 | 2026 | 2025 | 2026 | 2025 | 2026 | 2025 | 2026 | 2025 | 2026 | 2025 | |
| January | 115,950 | 67,100 | 45,042 | 15,740 | - | - | - | - | - | - | 160,992 | 82,840 |
| February | 111,150 | 118,750 | 24,952 | 40,900 | - | - | - | - | - | - | 136,102 | 159,650 |
| March | 99,460 | 89,510 | 4,656 | 45,030 | - | - | - | - | - | - | 104,116 | 134,540 |
| April | 71,950 | 78,500 | 7,764 | 57,710 | - | - | - | - | - | - | 79,714 | 136,210 |
| May | 72,250 | 52,400 | 11,324 | 72,400 | - | - | - | - | - | - | 83,574 | 124,800 |
| June | 33,780 | 68,720 | 7,180 | 46,450 | - | - | - | - | - | - | 40,960 | 115,170 |
| July | 90,330 | 39,010 | - | - | - | 129,340 | ||||||
| August | 81,900 | 36,500 | - | - | - | 118,400 | ||||||
| September | 97,650 | 7,100 | - | - | - | 104,750 | ||||||
| October | 109,860 | 32,800 | - | - | - | 142,660 | ||||||
| November | 90,560 | 44,240 | - | - | - | 134,800 | ||||||
| December | 111,760 | 16,110 | - | - | - | 127,870 | ||||||
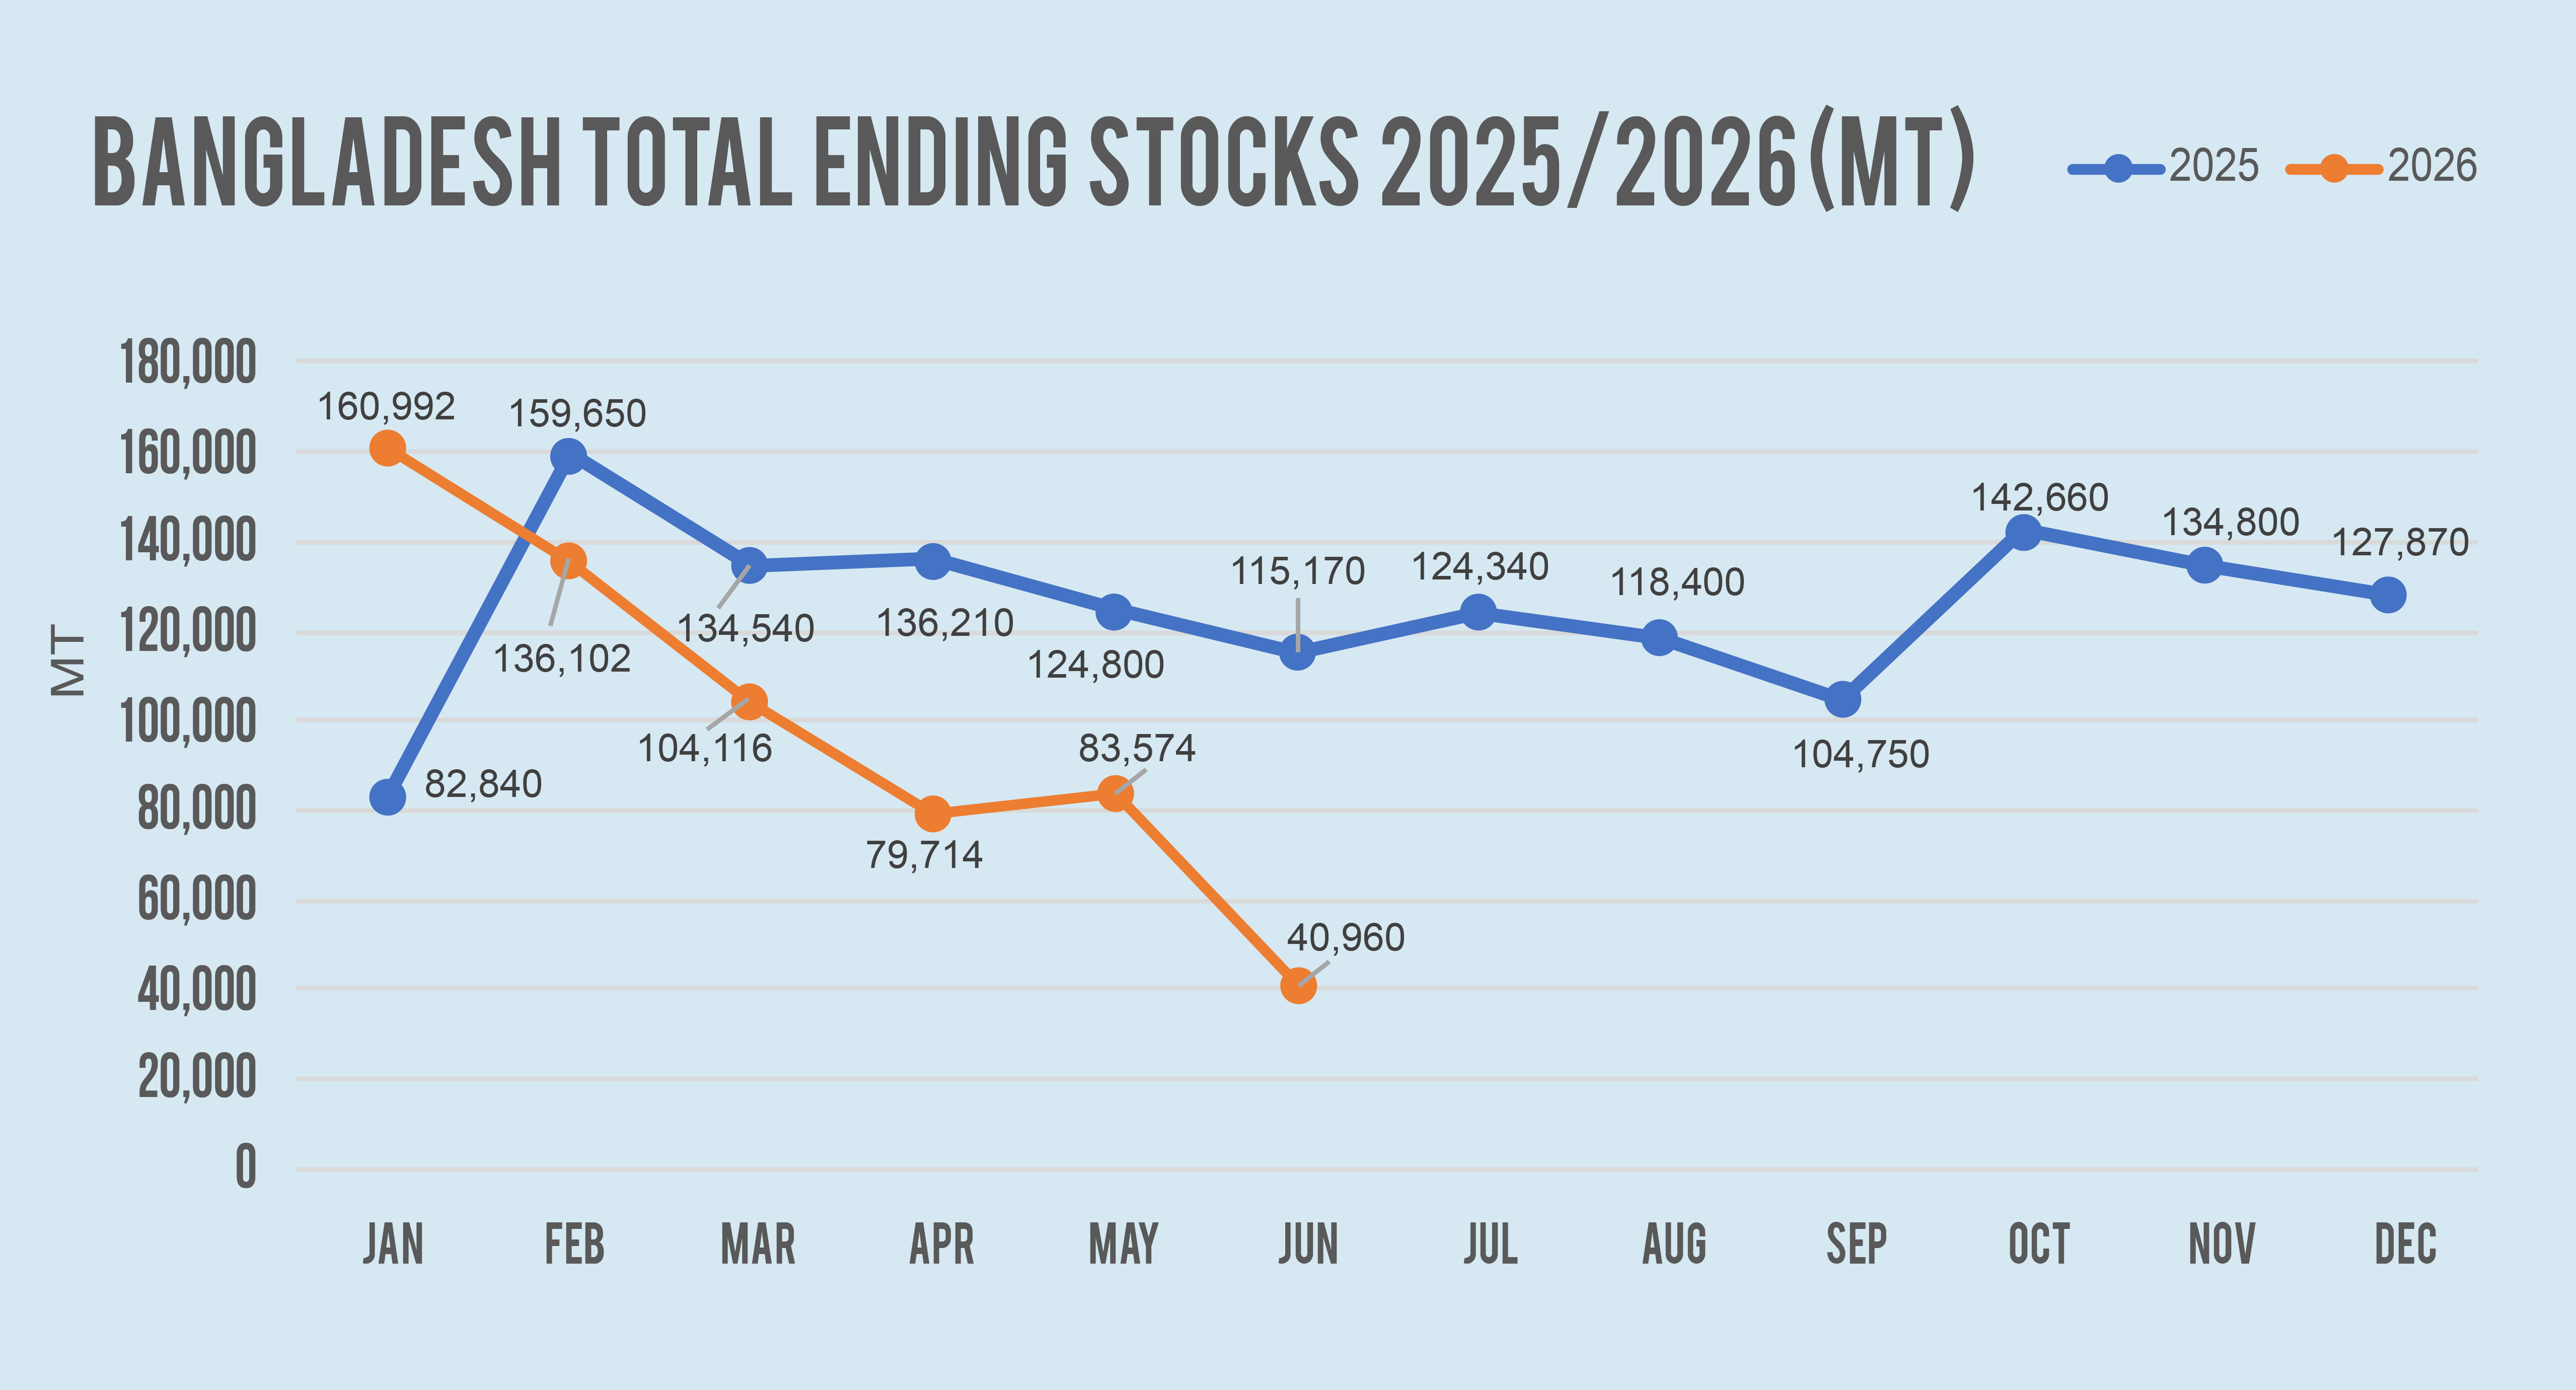
In June 2026, Bangladesh's total edible oil ending stocks declined sharply to 40,960 MT, representing a 50.99% month-on-month decrease from 83,574 MT in May 2026. Compared with 115,170 MT recorded in June 2025, total inventories were 64.43% lower year-on-year, highlighting a significant tightening in the country's edible oil stock position entering the second half of the year.
Palm oil inventories fell to 33,780 MT in June from 72,250 MT in May, a 53.25% month-on-month decline. Compared with 68,720 MT in June 2025, palm oil stocks were 50.84% lower year-on-year. Despite the sharp reduction, palm oil continued to account for the majority of Bangladesh's edible oil inventories, reflecting its dominant role in the country's supply chain and consumption pattern.
Soybean oil stocks also declined, falling to 7,180 MT from 11,324 MT in May, representing a 36.59% month-on-month reduction. On a year-on-year basis, inventories plunged 84.54% from 46,450 MT in June 2025, indicating that soybean oil remains the tightest segment of the edible oil market and continues to face lower stock availability than historical levels.
Overall, the sharp drawdown in both palm oil and soybean oil inventories indicates that refiners entered July with relatively lean stock positions. With total inventories falling to their lowest level in the first half of 2026 and the lowest recorded in the past two years, the market is likely to remain highly dependent on the timely arrival of import cargoes and effective stock replenishment to maintain adequate supply during the coming months.
Source: MPOC Market Intelligence
*Disclaimer: This document has been prepared based on information from sources believed to be reliable but we do not make any representations as to its accuracy. This document is for information only and opinion expressed may be subject to change without notice and we will not accept any responsibility and shall not be held responsible for any loss or damage arising from or in respect of any use or misuse or reliance on the contents. We reserve our right to delete or edit any information on this site at any time at our absolute discretion without giving any prior notice.
| Country : USA | ||||||||||||
|---|---|---|---|---|---|---|---|---|---|---|---|---|
| Oils and Fats Ending Stocks | ||||||||||||
| Palm Oil (MT) | Soybean Oil (MT)* | Sunflower Oil (MT)* | Rapeseed Oil (MT) | Other Oils (MT) | Total Ending Stocks (MT)* | |||||||
| 2026 | 2025 | 2026 | 2025 | 2026 | 2025 | 2026 | 2025 | 2026 | 2025 | 2026 | 2025 | |
| January | 159,000 | 159,000 | 795,000 | 694,000 | 29,000 | 26,000 | 57,000 | 55,000 | 121,000 | 126,000 | 1,161,000 | 1,060,000 |
| February | 159,000 | 159,000 | 795,000 | 694,000 | 29,000 | 23,000 | 57,000 | 56,000 | 121,000 | 126,000 | 1,161,000 | 1,058,000 |
| March | 159,000 | 159,000 | 836,000 | 694,000 | 29,000 | 23,000 | 57,000 | 55,000 | 121,000 | 126,000 | 1,202,000 | 1,057,000 |
| April | 159,000 | 159,000 | 836,000 | 658,000 | 29,000 | 23,000 | 57,000 | 55,000 | 121,000 | 126,000 | 1,202,000 | 1,021,000 |
| May | 136,000 | 159,000 | 860,000 | 694,000 | 27,000 | 29,000 | 67,000 | 56,000 | 88,000 | 126,000 | 1,178,000 | 1,064,000 |
| June | 136,000 | 159,000 | 851,000 | 694,000 | 27,000 | 29,000 | 66,000 | 57,000 | 88,000 | 126,000 | 1,168,000 | 1,065,000 |
| July | 159,000 | 758,000 | 29,000 | 64,000 | 126,000 | 1,136,000 | ||||||
| August | 159,000 | 781,000 | 29,000 | 64,000 | 126,000 | 1,159,000 | ||||||
| September | 159,000 | 787,000 | 29,000 | 81,000 | 126,000 | 1,182,000 | ||||||
| October | N/A | N/A | N/A | N/A | N/A | N/A | ||||||
| November | 159,000 | 783,000 | 29,000 | 81,000 | 126,000 | 1,178,000 | ||||||
| December | 159,000 | 783,000 | 29,000 | 81,000 | 126,000 | 1,178,000 | ||||||
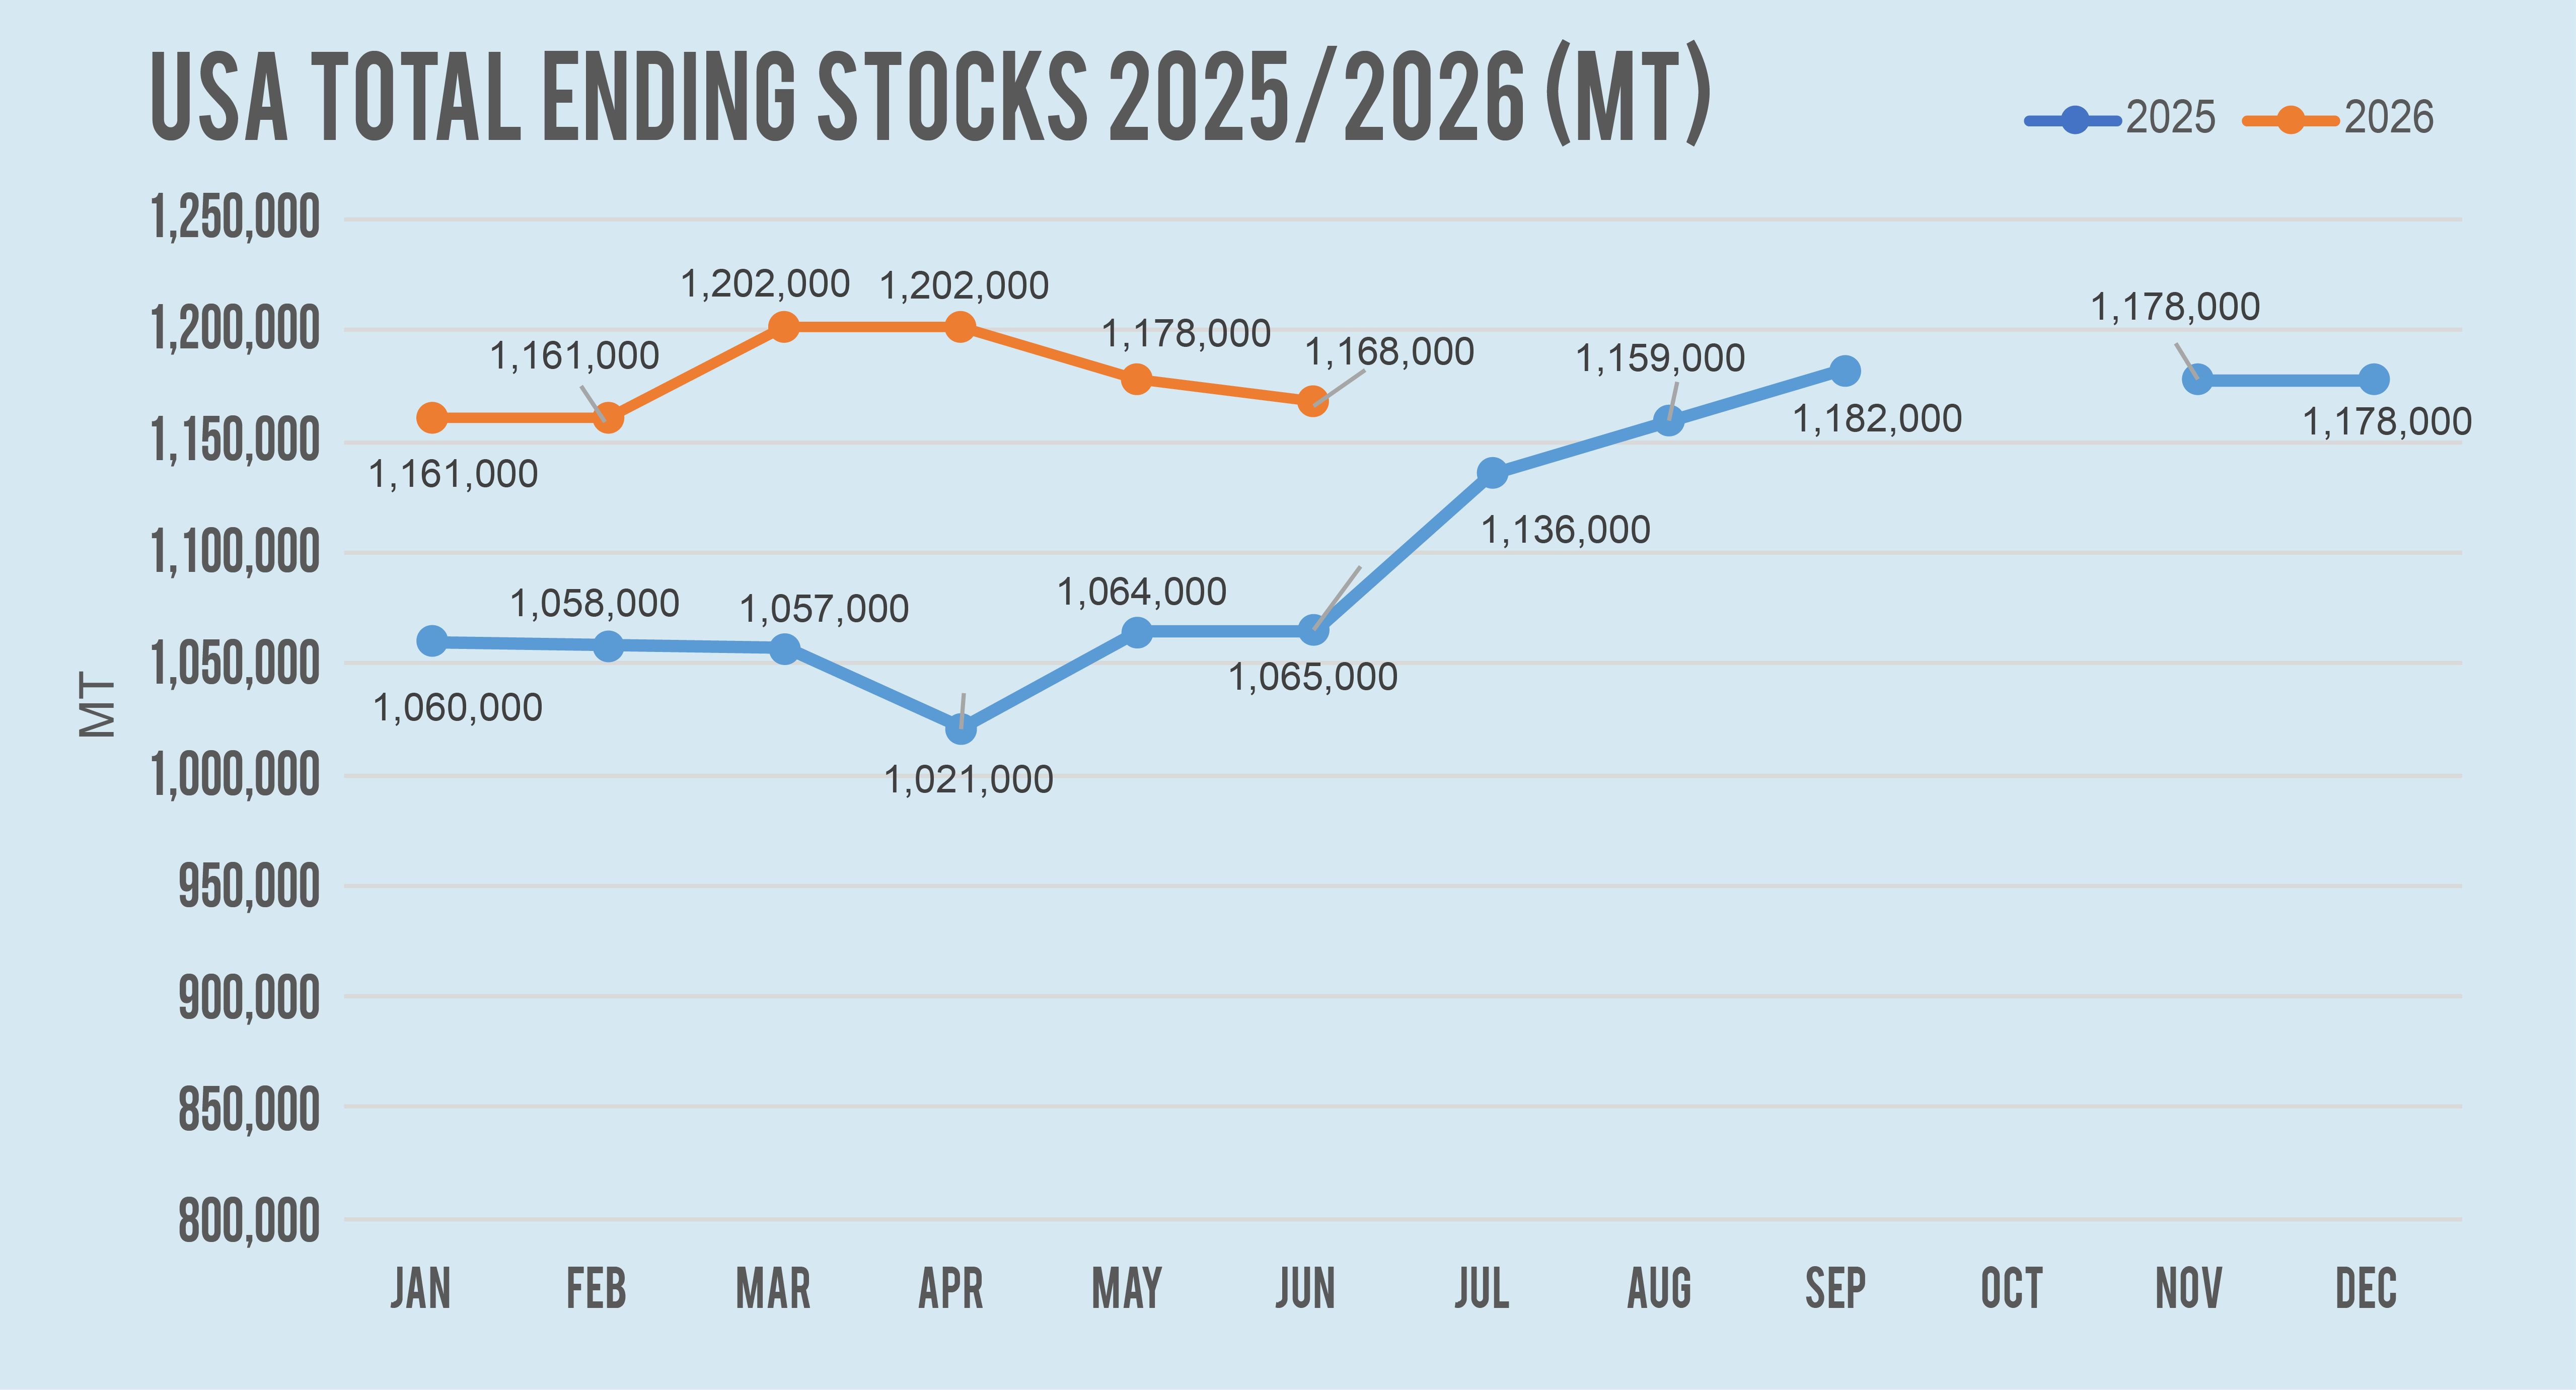
As of June 2026, U.S. ending stocks stood at 1,168,000 MT, down 0.85% from the previous month. Soybean oil ending stocks decreased by 1.05%, while rapeseed oil stocks fell by 1.49%. Palm oil and sunflower oil ending stocks remained unchanged. In Argentina, soybean crushing increased, supported by a recovery in processing activity and large arrivals of Paraguayan soybeans. However, biodiesel production remained weak due to poor export demand and continued reliance on limited domestic consumption. In Brazil, soybean crushing remained high, supported by strong net exports. Soybean oil production is expected to increase by more than half a million MT this year, which could lead to higher soybean oil exports. Brazil’s biodiesel mandate remains at 15%, with soybean oil accounting for 78% of the biodiesel feedstock in May 2026. In the U.S., biodiesel production is recovering strongly, with output forecast to reach a new high. Growth is supported by ambitious biofuel blending mandates and the 45Z Clean Fuel Production Credit. However, U.S. soybean oil exports declined due to uncompetitive prices. Following the announcement of a sharp increase in the U.S. biofuel mandate for 2026, obligated parties began covering compliance credit requirements, leading to an increase in D4 RIN prices.
Source: *USDA, MPOC Estimates
*Disclaimer: This document has been prepared based on information from sources believed to be reliable but we do not make any representations as to its accuracy. This document is for information only and opinion expressed may be subject to change without notice and we will not accept any responsibility and shall not be held responsible for any loss or damage arising from or in respect of any use or misuse or reliance on the contents. We reserve our right to delete or edit any information on this site at any time at our absolute discretion without giving any prior notice.